I met with Dr. Leonardo Solmsky to ask him what is being done there at the university.
I met with Dr. Leonardo Solmsky to ask him what is being done there at the university.
A few months ago I interviewed Sharon Leffler, a PhD student in Prof. Miguel Weil's group in the Department of Cell Research and Immunology in the Faculty of Life Sciences at Tel Aviv University, on the subject of developing a research model for 'orphan' diseases. At the end of the interview, Sharon told me about a new and unique robotic system that is installed in their laboratory and can quickly and efficiently test the effect of a large number of substances on 'sick' cells in order to find new drugs.
Dr. Solmsky is responsible for the operation of the laboratory called Cell screening facility for personalized medicine. I visited him to hear more about his unique work. He acquired the knowledge of the technology during an internship in several laboratories abroad, mainly at Harvard University.
Dr. Solmsky was born in Argentina and immigrated to Israel in 2003. He is a biochemist, pharmacist, and biologist and did his doctoral thesis at the Faculty of Life Sciences at Tel Aviv University. He is married + a child, and in his spare time he likes to spend time with his family, run or play music.
Leonardo, so what are you doing there?
The general purpose of the laboratory is to test and sort materials and find candidates for drugs for neurodegenerative and sometimes rare diseases (APBD, ALS, FD, MNGIE, etc.), therefore they are not a target for the pharmaceutical companies ("orphan" diseases). The work is done using a unique computerized system that consists of several devices that coordinate with each other. The working method is called high content screening, in which sick cells are photographed under a large number of different treatments and with the help of the images, changes in various parameters are looked for that would indicate an improvement in the condition. Although we were the first to import it to Israel, today there are other systems. However, we are still the only ones who have integrated the robot with the image collection system and the incubator. That means the process is automatic from the moment the cells are inserted until the data is received from their imaging.
Tell me about the system
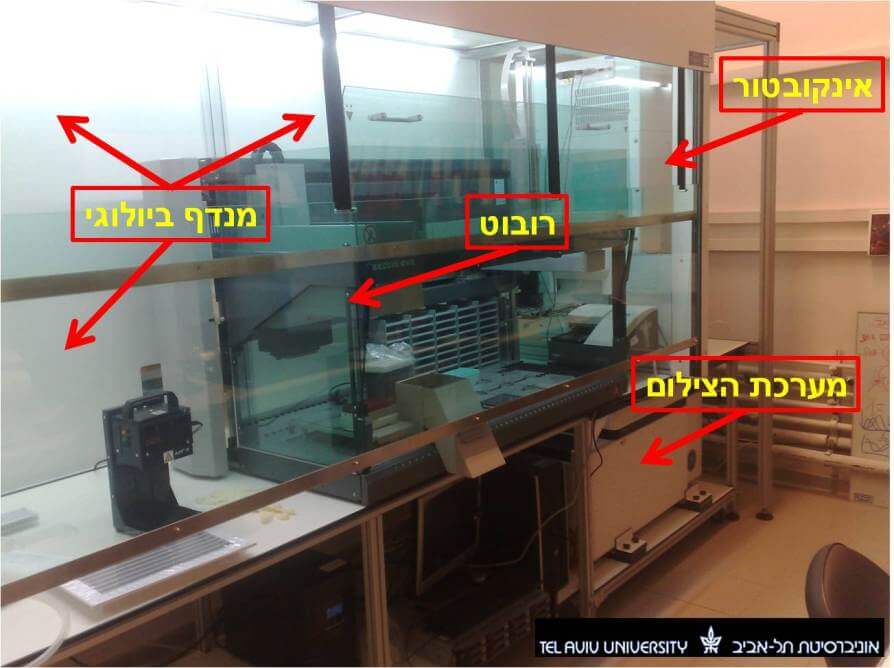
The system includes a robot that performs mechanical operations to prepare the measured samples, a device called 'IN Cell Analyzer 2000' that is capable of taking a large number of images at different wavelengths in a short time, an automatic incubator that allows cells to grow in a controlled manner by the robot, and software for automatic analysis of the images (see photo 1 ). The entire preparation process is carried out in a sterile atmosphere in a biological hood.
How is a system experiment performed?
Before starting the experiment, the differences between healthy and diseased cells must be characterized because we intend to investigate and characterize the response of diseased cells to different substances. This preparation step is done in our unit in advance before the screening process.
At the beginning of the experiment, the cells we want to test must be prepared. As part of the preparation of the cells for the experiment, we usually use different fluorescent dyes to mark different organelles or proteins of interest in the cell.
The mechanical robot performs all the operations required to prepare the plates containing the cells for photography. We provide the robot with special plates with a large number of small cells, a reservoir of cells and the desired materials, and the robot does the rest. He sows the cells in the wells, adds materials when necessary and transports the plates between the various stations in the system. We want to test the effect on the cells of about 20,000 different substances taken from a library of small molecules. The robot performs the task with efficiency, accuracy and speed that are not possible for a human researcher.
How is the photo taken?
The plate, which contains a large number of slides with cells that have been exposed to substances and then stained, is inserted into the camera by the robot. Each bar is photographed in several fluorescent wavelengths according to the dyes we used. The photography is very fast, with high resolution and a wide image. After the photo is taken, the photos are sent to the analysis computers.
What is the analysis process?
The process contains several steps. The first step is called segmentation, in which the software differentiates between the pixels that contain information and those that make up the background. The software identifies objects in the image such as cells or nuclei, each at the wavelengths in which they were stained. On the station's computers there are programs that run algorithms that specialize in performing these operations, but in order to obtain an optimal result, fine adjustments are required that are performed by the user and require expertise in operation and experience.
The next step is to connect the images of the different wavelengths. For example, if the cells are colored red and the nuclei are blue, the segmentation step will identify all the red pixels that make up a certain cell, and all the blue pixels that make up a certain nucleus. In the connection phase, called LINKAGE, the software will unite all the red pixels of the cell with all the blue pixels of its nucleus under one object which is the same cell.
In the measurement phase we decide which parameters we want to analyze for those objects detected by the software. You can look at many parameters in each of the organelles that make up the cell such as: number, size, signal strength, scope, shape, location, distance to other organelles, and many more, and also define new parameters yourself.
So what are you usually looking for?
We do something called: Phenotypic drug discovery. We search in the images under which treatments the parameters of the diseased cells look more similar to the healthy ones. These substances would be good candidates for drugs to treat the disease.
You said there are about 20,000 bars and dozens of parameters, how do you track the changes?
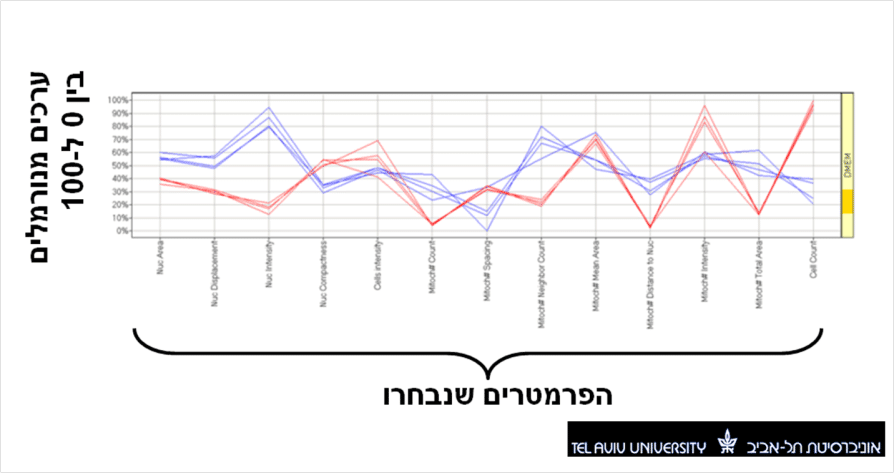
There are several methods to deal with all this information. All kinds of statistical analyzes can be performed, and the information can be presented in different forms. I will give you an example of one of the methods called Profile chart. With this method, we choose to work only with a few parameters that seemed different between healthy cells and patients in the early characterization phase. We normalize the values measured in diseased cells that have undergone treatment between 0 and 100, so that they can all be displayed on the same graph. The graph contains several parameters on the horizontal axis and their normalized value on the vertical axis, and its shape is the characteristic of a cell, so that all healthy cells, for example, will show a very similar pattern in such a graph, and different from that shown by sick cells (see picture 2). The software can perform a statistical analysis on the graphs produced from the photographs and find the substances that caused a pattern close to that of healthy cells. All this can be done without analyzing the effect of the material on each and every feature individually. This is essentially the drug screening process, and for about 20,000 substances it may last about two months (including the preparation and measurement of the cells).
So what is your vision for the future?
As I explained, today we can use the system to scan in a relatively short time a huge number of substances that can be used as drugs for various diseases. What we aim to establish in the future is a treatment system in which cells can be taken from a single person and drugs can be tailored to him personally at a reasonable time and price. This is the vision, and hence the name of the laboratory: Cell screening facility for personalized medicine.

4 תגובות
Thanks for the answer (suddenly I noticed that we have the same name :-))
Anyway, I think it can look nice even without the lines, you would simply see a cluster of blue dots (or spots) in a certain area for healthy cells, and a cluster of red dots in another area for sick cells.
Hi Oren,
I think I agree with your point in the first comment. If I understood the graph correctly, the purpose of the lines is purely visual. The true degree of correspondence between the graphs is found by a computer program with the help of precise algorithms.
During the interview he showed me Dr. Solmsky a computer screen with dozens of such graphs. The magic is that when you draw the lines you can quite easily spot the matches even without an exact calculation, just by glancing at the shapes.
By the way, I really like the use of robots and automated processes in order to speed up the pace of work and research. This robot reminded me of a robot from another study:
"Right now, it's recording from a cell. It does this 24 hours a day, seven days a week. It doesn't sleep and it never gets frustrated. It's the perfect postdoc... That's when the robot goes to work.... it can generate hundreds of data points a day, or about 10 times more than an efficient lab technician.... So much of what we do in science isn't actually science.... I say let robots do the mindless work so that we can spend more time thinking about our questions.... According to Markram, the patch clamp robot helped the Blue Brain team redo 30 years of research in six months"
http://seedmagazine.com/content/article/out_of_the_blue
First of all fascinating, and simply explained.
Regarding the graph, I did not understand the meaning of connecting lines between the various parameters on the X axis? (as you can see in the picture) it is not about a timeline, these are separate and independent parameters (at least some of them) why connect them with lines and not just show the points themselves?
Just wondering (although visually it looks nice, but meaningless)