2017 was the second or third warmest year since average global temperature measurements began, several different organizations around the world announced on Tuesday. Stripping out the impact of the strong El Niño phenomenon in 2015-2016, which added to their average global temperature, 2017 was the warmest year since records began.
The average global temperature in 2017 was among the highest since measurements began in the 19th century, several organizations around the world announced yesterday (Thursday). According to NASA, 2017 was the second warmest year, after 2016, while the National Oceanic and Atmospheric Administration (NOAA), the UK Met Office and the Japan Meteorological Agency found it to be the third warmest year, after 2016 and 2015. Another organization, the Copernicus Climate Change Service of the European Union, measured 2017 as the second warmest year, similar to NASA.
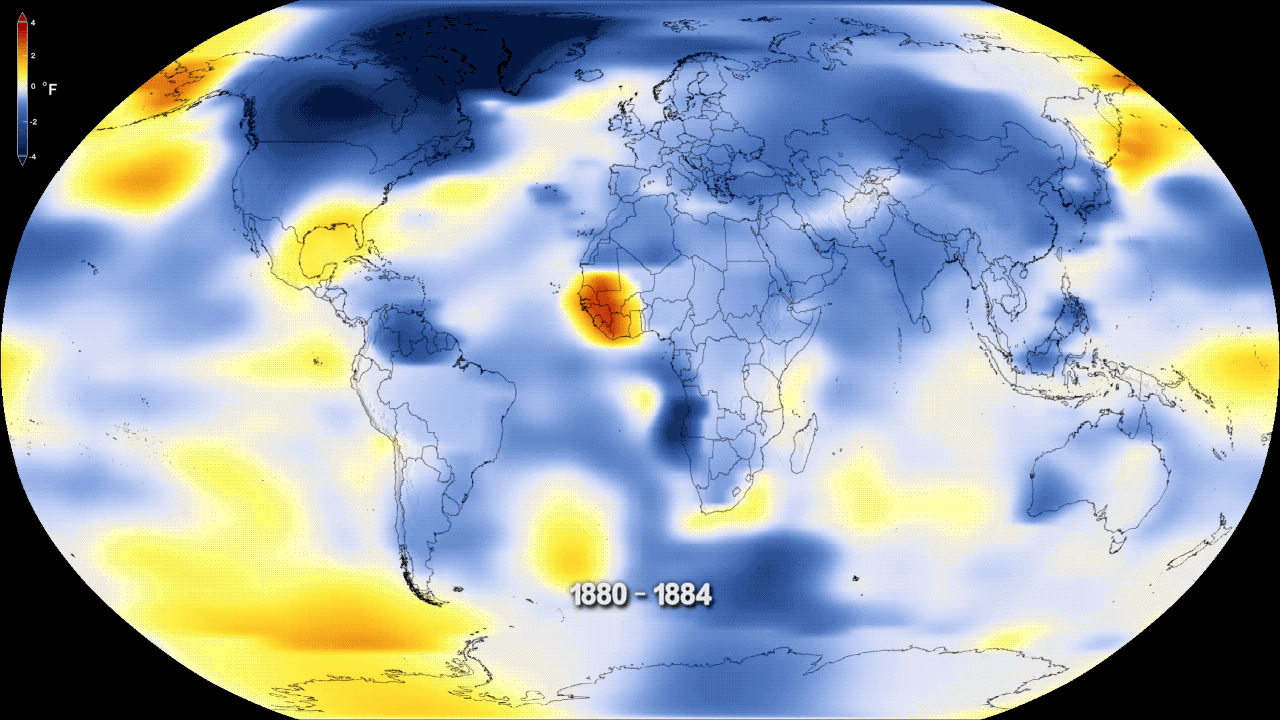
Measuring the global temperature of the earth is not a simple task, and is based on thousands of different measuring stations throughout all the continents and oceans. The differences between the organizations' measurements stem from different ways of analyzing and processing raw information - especially In the polar regions, where there is a lack of measuring stations.
according to Weighting included the separate measurements, carried out by the World Meteorological Organization (WMO) of the United Nations, 2017 was about 1.1 degrees Celsius warmer than the average temperature in the pre-industrial period (which the WMO measures as a period of 1880-1900) - a change mainly due to greenhouse gas emissions, such as carbon dioxide, to the atmosphere. Compared to the average temperature of a later period between 1981 and 2010, there was an increase of about 0.46 degrees Celsius in 2017.
According to the World Meteorological Organization, 2016 remains The hottest year, with an average temperature of 1.2 degrees above the pre-industrial period. In second place, according to the organization, are the years 2015 and 2017, with a negligible temperature difference of less than a hundredth of a degree between the two, which is within the statistical margin of error.
Despite its second or third position in the ranking of the hottest year, the various organizations agree that if the effect of the phenomenon ofEl Niño The hold that happened in 2015 and 2016, the year 2017 is becoming extremely hot. The El Nino phenomenon is characterized by the warming of part of the waters of the Pacific Ocean, in a way that contributed to the average global temperature of those years. Beyond that, 2017 began and ended with a contrasting phenomenon of La Niña Weak, where part of the Pacific Ocean cools.

Whether 2017 is the first, second or third hottest year - variations in the global temperature are expected to happen from year to year, and not every one has to be a record breaker as part of the warming phenomenon. At the same time, the phenomenon is clearly expressed from the following figure (According to data NOAA): While in the period between 1880 and 1980, a global temperature record was recorded once every 13 years, in the period between 1981 and 2017, a new record was recorded once every three years. In addition, since 2010 the record has already been broken five times.
"The long-term trend of the temperature is much more important than a ranking of individual years, and this trend is upward," said the Secretary-General of the World Meteorological Organization, Petri Tallas. "17 of the 18 warmest years have all happened this century, and the degree of warming over the past three years has been extraordinary. The Arctic heat was particularly emphasized, and this will have deep and long-lasting consequences on the sea level, and on weather patterns in other regions around the world."
"The temperatures only tell part of the story. The heat in 2017 was accompanied by extreme weather in many countries around the world. The United States of America experienced its most expensive year in terms of weather and climate disasters, while other countries saw their development slowed or reversed by tropical cyclones, floods and droughts."
"Despite colder-than-average temperatures in each of the world's regions, the temperature across the planet as a whole continues the rapid warming trend we've seen over the past 40 years," said Gavin Schmitt, director of NASA's Goddard Institute for Space Studies (GISS), which was responsible for conducting the agency's measurement. . This statement can be seen as intentional to a tweet he wrote Recently US President Donald Trump, during the intense cold that fell last December on the east coast of the US: "In the east, this may be the coldest temperature recorded on New Year's Eve. Maybe we need some of that good old global warming…”
Trump, as I recall, He announced Last year the US intended to withdraw from the climate agreement signed in Paris in 2015. The agreement established a goal of reducing global warming to an increase of up to 1.5 degrees Celsius, relative to the average temperature of the pre-industrial period. As mentioned, 2017 recorded an excess of 1.1 degrees, so we are very close to this goal.
"In just 18 years our greenhouse gas emissions have pushed up the global temperature by 0.4 degrees Celsius. At this rate, the target from the Paris Agreement of 1.5 degrees will be crossed in less than two decades," said Professor Stefan Remstorf from the University of Potsdam in Germany. According to a report in the Guardian.
In addition to the data on the increase in the global temperature, another problematic trend is worth noting - the melting of the glaciers. According to NOAA, the extent of the area covered by the sea ice in the Arctic region was 10.38 million square kilometers - the second smallest since it began to be measured in 1979. The extent of the sea ice area in Antarctica last year was the lowest since measurements began, with 10.64 million square kilometers.
Links to the various measurements: NASA / Met Office / NOAA / Japan Meteorological Agency / Cuprincos Climate Change Service
See more on the subject on the science website:
