Between rain and flood, between time and terrain, between yesterday and tomorrow

The phenomenon of extreme rains is at the center of the research of Prof. Efrat Morin from the Institute of Earth Sciences at the Hebrew University of Jerusalem, and the students in her group. Extreme rains can endanger lives and cause a lot of damage, such as floods, landslides, and more. These phenomena occur everywhere in the world. Understanding the spatial and temporal scale in which extreme rains operate may help to prepare appropriately, which will enable saving lives and reducing damage.What is the question? How to use the area dimension and rain data from remote sensing, to understand the extreme rains and their risks?
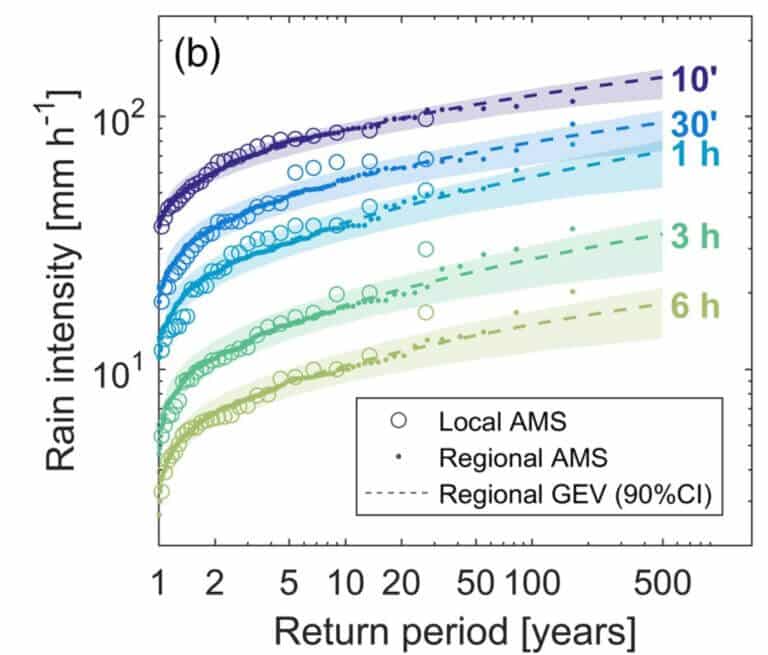
The risk rate of the extreme rains is defined by the probability that an event of a given scope (at least) will occur, and to describe the risk rate it is customary to use the concept of "return period". For example, if in the coastal plain area there is a 1% probability that in a given year there will be an event of a fall of at least 50 mm for one hour, because then it is customary to say that the return period is 100 years - on average, this type of event will occur every 100 years. In this example, the time period in question is an hour, but it may vary depending on the phenomenon being studied. For example, in the case of urban flooding, the relevant period of time will be a few minutes, and in the case of a flood in a stream such as the Yarakon, the appropriate duration will be hours, and perhaps even days. The hydrologists usually define these relationships using "rain intensity-duration-frequency curves". Such curves are calculated for different places based on data from rain stations that measure the rain intensities in these places. In Israel, for example, there are several dozen rain stations.

In this conventional description one important factor is missing - the area. The standard analysis represents rain points (stations), and there is no consideration of the area covered by the rain. But in order to understand phenomena like the ones that this research focuses on, it is important to know what the area that the rain covers is. For example, the catchment basin of a stream with an area of 1000 square kilometers. If an extreme rain event occurs but the area covered by the rain is small, for example one square kilometer, a major flood in the stream will probably not occur. On the other hand, if the same intensity of rain covers a considerable area of the 1,000 square kilometers of the Hikva basin, a powerful and unusual flood may occur.
This is precisely the importance of this study, in which Prof. Morin and her team, in collaboration with Francesco Mara and other research partners, and with the assistance of a research grant from the National Science Foundation, propose to expand the existing analysis, which only refers to the intensity of the rain, its duration and frequency; and add the area to it as well, so that the spatial factor will also be included in the analysis. For this purpose, they use rain data obtained by remote sensing - for example, a meteorological radar, which allows receiving high-resolution rain data - as well as advanced statistical analysis methods. The researchers plan to identify for each Hikva basin the appropriate area and extension, so that the frequency of the rains will also express the frequency of Floods in the Hikva basin.

The research led by Prof. Morin is ongoing these days. In the first phase of the research, the database was established that included rain intensities from the radar of the meteorological service in Beit Dagan. After that, a new statistical method was developed that would allow the calculation of frequencies to match the radar data, whose number of years of data is limited.
In fact, this new method also shows good results for data obtained from rain stations. In the future, the research team plans to calculate the rain in different areas and for different durations, for each pixel in the space, and to use the statistical method it developed. Finally, the team plans to identify for each Hikva basin the area and extension suitable for it so that the frequency of the rains will also reflect the frequency of floods in the Hikva basin. That is, rain that will be defined as "rare" for the duration and area that will be identified for a certain catchment basin, will be identified with the possibility of creating a rare flood in that basin. Continue and the area to be chosen is related to the nature of the hydrological response. Thus, for example, in the Hikva basin where there is a rapid creation of surface runoff (e.g. in a built-up area) continuation will be short, compared to the Hikva basins where there are natural areas with dense vegetation that slows down the creation of runoff and flow, where continuation will be relatively long. The area is related to the size of the catchment basin but also to other features of the surface and the rainstorms.

Life itself:

In her spare time (which is relatively little), Prof. Maureen likes to go on hikes in beautiful places, throughout Israel, and in other parts of the world.
More of the topic in Hayadan:
- Art and science - Einstein's crooked universe
- How do we know about an approaching flood?
- The Tales of Naot Hekhar Part III - Flood
- The forgotten sailor who caught Columbus will prove: China is a world power, but it wants peace
- On evolutionary pathways of enzymes and communication between sophisticated bacterial populations

One response
interesting