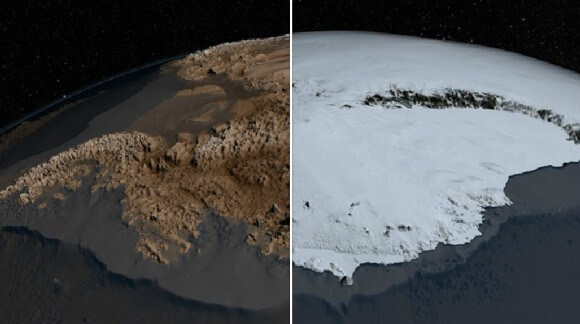
Using data from the ICESat satellite and the IceBridge airborne survey, scientists have built a map of Antarctica under the ice - in order to enter the data into a model that will predict what will happen to that huge ice cap as a result of global warming

Although Antarctica is an isolated continent located at the "bottom of the world", it is one of the most important continents on Earth. It affects the weather, climate and ocean current patterns all over the world. However, Antarctica is also one of the enigmatic continents. It is remote, the living conditions there are difficult and it is covered by a layer of ice over two kilometers thick. As temperatures around the globe continue to climb, the future of Antarctica, which is quite a continent, is also a concern for scientists. However, in order to know how the ice covering it will react to the changing conditions, they want to know what exactly is under the ice.
Researchers from the British Antarctic Survey, with the help of NASA's ICESat satellite data and the airborne survey IceBridge, also of NASA managed to provide a better view of the geological formations hiding under the ice sheet.
The Bedmap2 dataset provides a clear picture of Antarctica from the surface of the ice to the bedrock. Bedmap2 is a significant upgrade compared to the previous collection of data on Atnaratica, Bedmap which was developed over a decade ago. The new product is the result of the work of British survey researchers who processed many geophysical measurements, such as surface height measurements from the ICESat satellite and data on the thickness of the ice collected in the IceBridge operation
Bedmap2, like the original Bedmap survey, is a collection of three data series: surface elevation, ice thickness and rock topography. Both surveys - the old and the new - are constructed as grids covering the entire continent, but the denser grid of Bedmap2 includes ground and subsurface formations that were too small to be seen in the first survey. In addition, the massive use of GPS data in the latest survey has improved the accuracy of the data. The improvements in resolution, coverage and accuracy will lead to more accurate calculations of ice volume and the potential contribution of its melting to sea level rise.

The ice sheet researchers used computer models to perform a simulation that would allow them to estimate how the ice masses would respond to changes in ocean and air temperatures. The advantage of these simulations is that they allow the testing of different climate scenarios, but the models will be limited by the level of accuracy of our knowledge about the volume of the ice and the route of the land under the ice.
"In order to achieve accurate results in the simulation of the ice sheet's dynamic response to changing environmental conditions such as temperature and snow accumulation, we need to know the shape and composition of the bedrock under the ice in greater detail," says Michael Stödinger, a scientist in NASA's IceBridge project at the Goddard Space Center. Knowing the shape of the bedrock is important for modeling the ice cover because these formations control the shape of the ice and affect its movement. The ice will move faster on a steep slope of a mountain, while on the slopes or over bumpy ground the movement of the ice block will slow down or even stop temporarily.
"The formation of the bottom is the most important variable in the equation and it affects the movement of the ice" says Peter Partwell, a scientist with the British Antarctic Survey and the principal researcher of Bedmap2. "You can affect the spread of the honey in the plate simply by changing the way you hold the plate. The improved soil data included in Bedmap2 may improve the level of detail needed to make models closer to reality.”
"This will be an essential source for the next generation of Antarctic ice sheet modellers, oceanographers and geologists," Pertwell concludes.
For the news in Universe Today
The article is presented as part of the collaboration between Universe Today and the knowledge site

4 תגובות
The records in Atnaratika are over 3,000 meters.
Ice 2000 meters thick means that the continent will actually be below sea level, if we remove the ice.
So it is not exactly a continent - unless there is a point where the rock is above sea level.
interesting.
In this regard, in this article:
Clark, PU, Archer, D., Pollard, D., Blum, JD, Rial, V,B., Mix, AC, Pisias, NG, Roy, M.,
2006. The middle Pleistocene transition: characteristics, mechanisms, and
implications for long-term changes in atmospheric pCO2. Quaternary Science Reviews 25,
3150-3184
A theory is advanced that the change in climate cycles and their deviation from the expected Milankovitch cycles in the middle of the Pleistocene occurred as a result of increased weathering of sedimentary layers and the exposure of the crystalline bedrock infrastructure in the Canadian shield with the higher friction, and as a result the accumulation of ice vertically and not horizontally. That is, the change in ice forcing and subsequently the climate cycle.
The reference to my article on Antarctica
https://www.hayadan.org.il/antarctic-mysstery-08090/