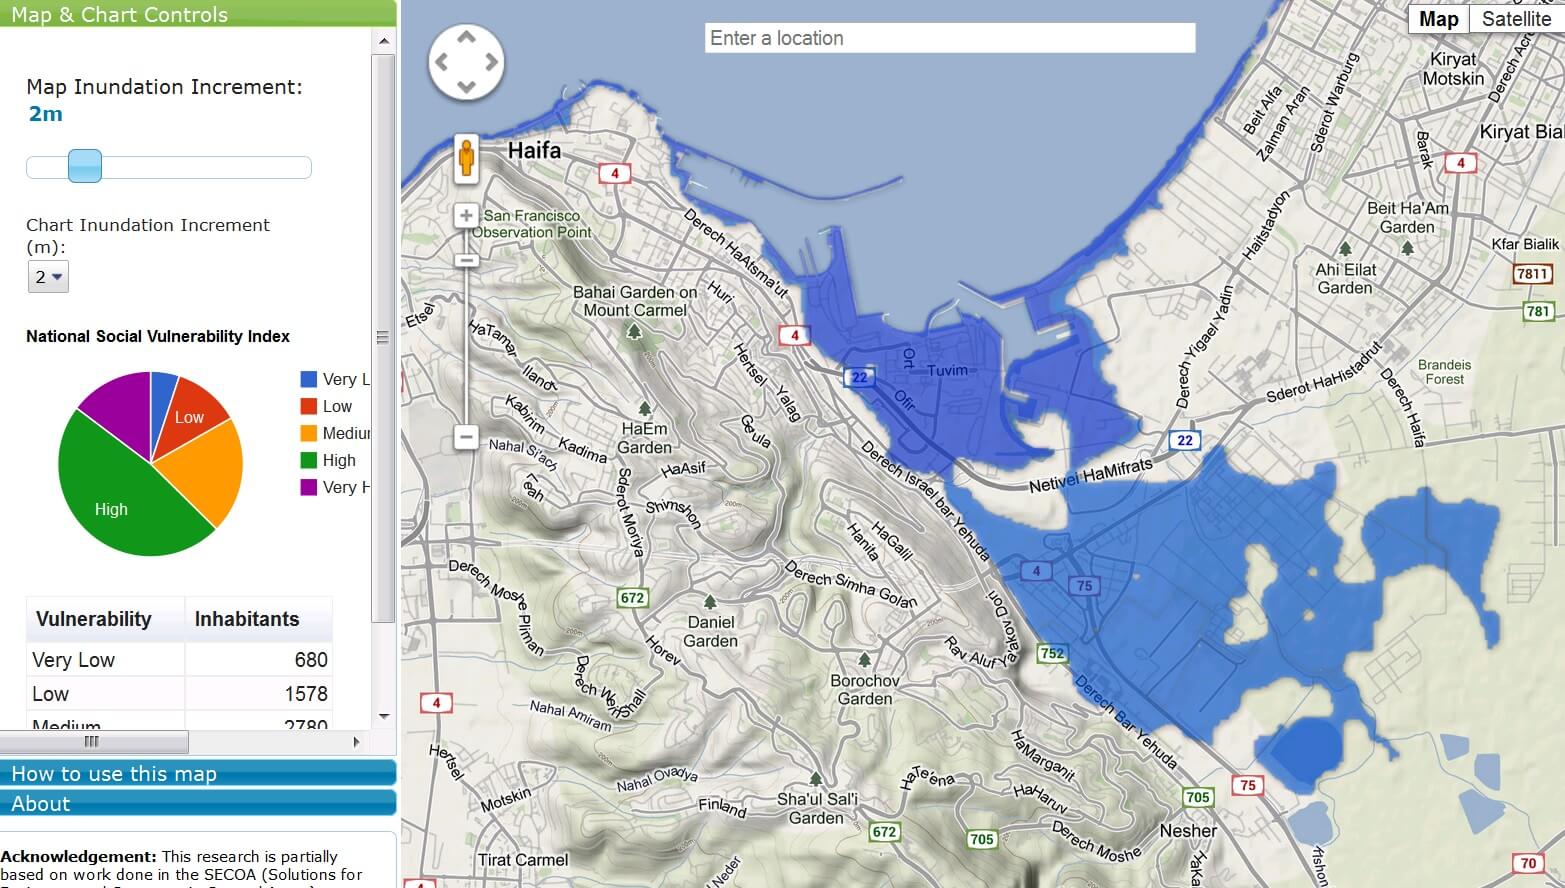
The system also predicts what Israel's coasts will look like if the sea level does rise by 2 meters by the end of the century
Hurricane "Sandy" that attacked the New York area last October, and before it the Katrina disaster in New Orleans raised the question of the vulnerability of different population groups following extreme flooding events as well as environmental disasters. In the Department of Geography at the Hebrew University, it was decided to develop a system that would be able to map areas that are potentially vulnerable to floods and various disasters in order to assess damage to property and populations in these areas.
Dr. Michal Leichter and Prof. Daniel Felzenstein developed a system of dynamic maps that are divided into three categories: assessment of populations at risk, economic assessment of assets at risk and social-economic vulnerability index of populations. The system maps marine flood areas in Israel under scenarios of sea level rise (which include a rise of up to 2 m in sea level in the 21st century) and various extreme scenarios of flooding.

The tool was developed in the department as part of a research project funded by the European Union (FP7) and enables interactive use: switching between different flood scenarios along Israel's coasts and presenting data regarding social and economic vulnerability in the form of tables and graphs for each scenario at the national and municipal level.
The system sits on a Google Maps platform where the user can simulate different levels of flooding from the sea and get immediate results regarding the expected damages along the coast in three different categories: social vulnerability, population at risk and damage values to buildings and capital stock.
"Traditionally, the public and professional discourse regarding natural extreme events has revolved around engineering questions such as the costs of protection or physical questions such as their ecological effects and damage to animal and natural systems. Very little attention is given to the social effects and the assessment of damages to property and populations." Prof. Felzenstein says. "The system provides available and new information to policy makers, local authorities, planners and trustees on disaster management. This information was until now presented in long reports and tables and is now accessed in an interactive and convenient way - by a simple click."
