On July 23, 1972, the Landsat satellite was launched, which changed our attitude to the environment. Since then the satellites have been perfected and now NASA is developing the Landsat 10 satellite, which will be able to reveal more details about the destruction of the Earth by humanity
By: Stacey Morford Environment and Climate Editor, THE CONVERSATION
Fifty years ago, the US launched a satellite into space that dramatically changed the way we see the world. He took pictures of the earth's surface in great detail, showing how fires burn large areas, how farms wipe out forests, and many other ways in which humans change the earth's surface.
The first satellite in the Landsat series was launched on July 23, 1972. Eight others followed, providing the same views so that changes could be tracked over time, but with increasingly powerful instruments. Landsat 8 and Landsat 9 are orbiting the Earth today, and NASA and the US Geological Survey are planning a new Landsat mission.
The images and data from these satellites are used to track deforestation and environmental changes around the world, locate urban heat islands, and help understand the impact of new river dams and many other projects. Often, the results help communities respond to risks that may not be obvious from a ground level view.
Here are three examples of Landsat in action, from The Conversation archives.
Tracking changes in Amazon
When work began on the Belo Monte Dam project in the Brazilian Amazon in 2015, indigenous tribes living along the Great Bend of the Shingo River began to notice changes in the river's flow. The water they relied on for food and transportation was disappearing.
Upstream, a new canal will eventually divert up to 80% of the water to the hydroelectric dam, bypassing the bend. The consortium that manages the dam claimed that there is no scientific proof that the change in water flow harms the fish.
But there is clear evidence of the impact of the Belo Monte Dam project, and it is visible from above. Thus, wrote Pritam Das, Faisal Hossain, Hörður Helgason and Shahzaib Khan from the University of Washington. Using satellite data from the Landsat program, the team showed how the dam dramatically changed the river's hydrology.
The foreground satellite image shows the Great Bend of the Shingo River on May 26, 2000, before the start of the Belo Monte Dam project. Move the slider to the left to see the same area on July 20, 2017.
"As scientists working with remote sensing, we believe that satellite observations can empower populations around the world facing threats to their resources," Das and colleagues write.
It's hot in the city - and even hotter in some neighborhoods
Landsat's instruments can also measure surface temperatures, allowing scientists to map heat hazard street by street within cities as global temperatures rise.
"Cities are generally hotter than surrounding rural areas, but even within cities, some neighborhoods are dangerously hotter than others just a few miles away," writes Daniel P. Johnson, who uses satellites to study the urban heat island effect at Indiana University.
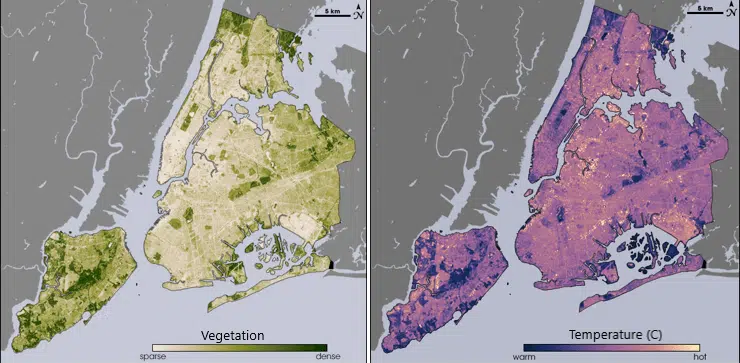
Neighborhoods with more sidewalks and buildings and fewer trees can be 5.5 degrees Celsius or more warmer than neighborhoods with extensive leaf cover, Johnson writes. He found that the hottest neighborhoods tend to be low-income, have a majority of black or Hispanic residents, and have been subject to redlining, the discriminatory practice used in the past to deny loans in racial and ethnic minority communities.
Two maps of New York show how vegetation is suited to cooler areas by temperature. Comparing maps of New York's vegetation and temperature shows the cooling effect of parks and neighborhoods with more trees. NASA/USGS Landsat
"Within these 'micro-urban heat islands,' communities can experience heat wave conditions long before officials declare a heat emergency," Johnson writes.
Knowing which neighborhoods face the highest risks allows cities to organize cooling centers and other programs to help residents manage the heat.
Creating ghost forests

Satellites that scan the same areas year after year can be essential for detecting changes in hard-to-reach areas. They can track snow and ice cover, and along the Atlantic coast of the US, swamp forests are dying.
These eerie landscapes of dead tree trunks, often bleached, have been nicknamed "ghost forests".
Emily Urey, an ecologist, now at the University of Waterloo in Ontario, used Landsat data to detect changes in wetlands. She then focused on high-resolution images from Google Earth – which includes Landsat imagery – to confirm that these were ghost forests.
"The results were shocking. We found that more than 10% of the forested wetlands within the Alligator River National Wildlife Refuge [in North Carolina] have been lost over the past 35 years. This is federally protected land, without any other human activity that can kill the forest," Uri writes.

As the Earth warms and sea levels rise, more saltwater reaches these areas, increasing the amount of salt in the soil of coastal forests from Maine to Florida. "It seems that the rapid rise in sea level is overpowering the ability of these forests to adapt to more humid and saline conditions," Uri writes.
Many more stories can be found in Landsat images, such as an overview of the war's effects on Ukraine's wheat crop, and how the algal bloom spread in Florida's Lake Okeechobee. Countless projects are using Landsat data to track global changes and potentially find solutions to problems, from deforestation in the Amazon to the wildfires that have set Alaska on pace for another historic wildfire season.
For the article on THE CONVERSATION website
More of the topic in Hayadan:
