A 10% increase in the proportion of students studying engineering among high school graduates in 20 years * The percentage of engineering students among all students is 24.7% for men and 7.2% for women *
Summary of the CBS data:
- The percentage of students studying engineering among high school graduates There was an increase of 0.6 percentage points, from the 1996 cycle (97/2006) to the 07/6.1 cycle (from 6.7% to XNUMX%, respectively).
- Among high school graduates in 2006/07 studying for a bachelor's degree in engineering: The percentage of men is higher than the percentage of women (10.0% vs. 3.8%, respectively) fThe percentage of Arabs is lower than the percentage of Jews (2.3% vs. 7.9%, respectively).
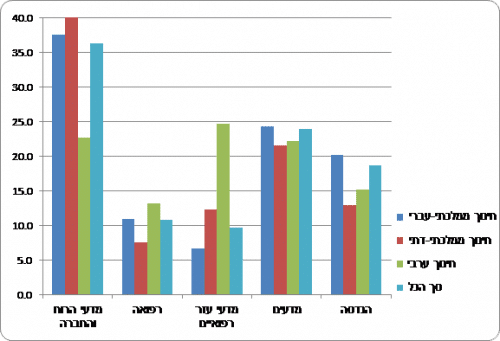
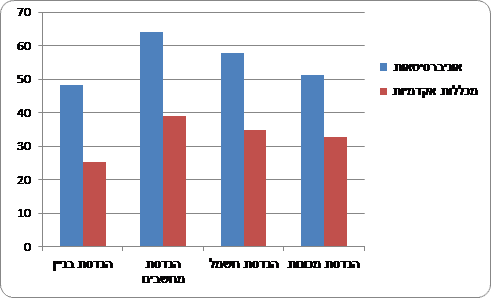
- The percentage of engineering students among all students is 24.7% for men and 7.2% for women. This percentage is lower than one percent Those who excel in the quantitative part of the psychometric exam who studied engineering for a bachelor's degree (35.7% and 18.7%, respectively). The percentage of graduates of state-religious education was lower than the percentage of graduates of state-Hebrew education (7.0% versus 9.5%, respectively).
- Those who excel in the quantitative part of the psychometric exam tend to study humanities and social sciences (36.3%) rather than engineering (18.7%) or sciences (24%).
- The percentage of honors students studying engineering is significantly higher than the percentage of women studying engineering (2.5 times).
- Among the graduates of the state-Hebrew, state-religious, and Arab education, the percentage of men who excelled in the quantitative psychometric exam who studied for a bachelor's degree in engineering was similar (36%-35%).
- Students from a socio-economic cluster Low and high are less likely to study engineering compared to students from a medium socio-economic cluster.
- Male graduates of state education are the group that is more inclined than all others to study engineering (13.5%). However, Arab women They are the population that very rarely participates in engineering studies (1.2%).
- for half (49.3%) of those receiving a bachelor's degree in engineering From universities There was at least One parent with a college degree, compared to 35.1% among graduates of academic colleges.
- The percentage of those graduating with a master's degree in engineering in the research track is on the rise, from 12.4% in 15.7 to XNUMX% in XNUMX.
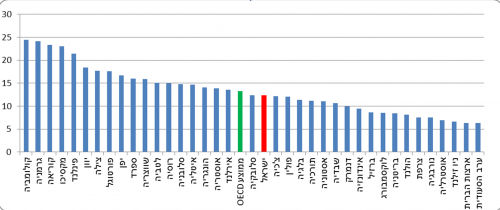
- In 2015, the percentage of bachelor's degree recipients in engineering in Israel (12.4%) was slightly low from the average ofOECD (13.4%).
This message follows to the previous message on the subject. In the current announcement, several new issues regarding engineering studies at universities and academic colleges were published: entry of high school graduates into engineering studies, entry of those who excelled in the quantitative part of the psychometric exam into engineering studies, engineering students according to socio-economic level, degree recipients, intergenerational leadership and comparison to the OECD.
Participation in engineering studies among high school graduates
6.7% of high school graduates[1] In the class of 2006/07, they studied for a bachelor's degree in engineering. 1[2] This is after an increase of 0.6 percentage points from the 1996 cycle (97/3.8). Among high school graduates in the class of 10.0, the percentage of women studying engineering was 2.6% compared to 2.7% among boys (approximately 2.6 times). The differences between men and women in participation in engineering studies did not change significantly from the 1 to 2 cycle - XNUMX times compared to XNUMX times, respectively. The gender gaps are particularly strong among graduates of Arab education and among graduates of state-religious education (see charts XNUMX and XNUMX).
The percentage of students studying engineering among all Jewish high school graduates in the 7.9 class is significantly higher than among Arabs (2.3% vs. XNUMX% respectively), this gap exists for both men and women.
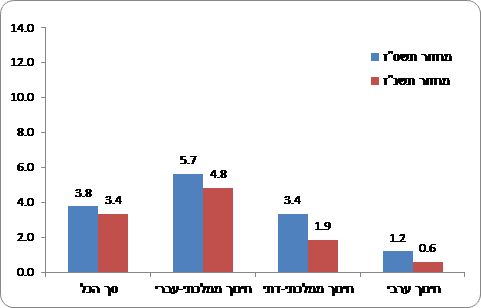
The graduates of the Hebrew state education studied engineering at a significantly higher rate than the graduates of the religious state education. This gap is especially large with regard to women. While among the female graduates of the state-Hebrew education (cohort 5.7) the rate of studying engineering is 3.4% among the female graduates of the state-religious education this rate was XNUMX%.
Among the different groups, the participation in engineering studies among men who graduated from the Hebrew state education is the highest (13.5% in 1.2) and among Arab women it is the lowest (XNUMX% in XNUMX), despite a significant increase in their rate since XNUMX.
Chart 1 - The percentage of participation of men who graduated from high school in XNUMX . In XNUMX . in engineering bachelor's degree studies within 9 years of graduating
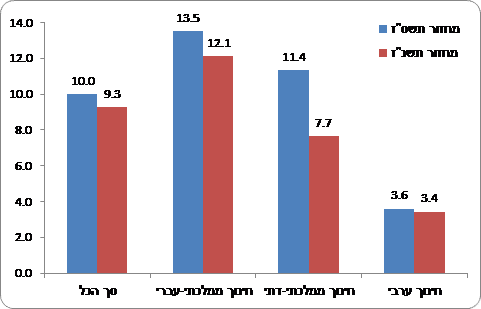
Chart 2 - The percentage of participation of women who graduated from high school in XNUMX . And in XNUMX . in bachelor's degree studies in engineering within 9 years from the end of their studies
Participation in engineering studies among those who excel in the quantitative psychometric exam
36.4% of the men excelling in the quantitative part of the psychometric exam[3] (received a score of 150-138), studied engineering for a bachelor's degree. This percentage is higher than the proportion of engineering students among all students (24.7%). Those who excel in the quantitative part study more engineering than sciences (29.2%), medicine (5.8%) or humanities and social sciences (26.3%).
In contrast, those who excel in the quantitative part of the psychometric exam tend to study engineering less than the men (18.7% versus 36.4%, respectively). However, this rate is higher than the rate of female engineering students (7.2%). They tend to study more social sciences and humanities (36.3%) or sciences (24.0%).
The percentage of participation in a bachelor's degree in engineering among those who excel (men) in the quantitative psychometric exam is similar among graduates of the various education systems: state-religious (36.5%), state-Hebrew (36.4%) and Arab (35.6%).
In contrast, among the honorees there are considerable gaps between the different types of education. Among the female graduates of the state-Hebrew education, the percentage of engineering students was 20.1%, while among the female graduates of the MMD education, this percentage was only 12.9%. 45.2% of the honors graduates of the state-religious education chose to study social sciences. Those who excelled in Arab education tended to study auxiliary medical sciences.
The percentage of those studying science among outstanding male graduates of the Hebrew state education (32.1%) is higher than the religious (19.2%) and Arab (20.1%) state education graduates. The excellent graduates of the Arab education are more likely to study medicine than the excellent ones of the Hebrew education, and the excellent ones of the state-religious education are more inclined to study the humanities and social sciences.
Chart 3 - The percentage of participation in higher education among those who excelled (men) in the quantitative part of the psychometric exam, according to selected fields of study2
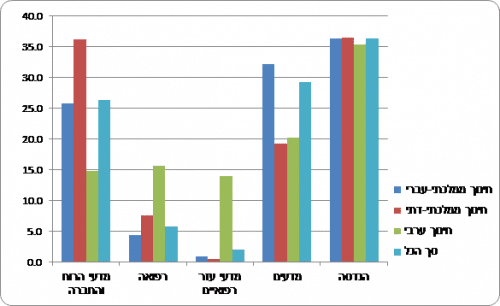
Chart 4 - The percentage of participation in higher education among those who excelled in the quantitative part of the psychometric exam, according to selected fields of study[4]
Socio-economic cluster of engineering students
In 2015/16 (11.1/12.9), 15.1% of students whose locality belonged to a low socio-economic cluster studied engineering, compared to XNUMX% of students whose locality belonged to a high socio-economic cluster and XNUMX% whose locality belonged to a medium socio-economic cluster.[5]
The engineering subjects studied by undergraduate students in the years 2008 (09/2015) and 16 (XNUMX/XNUMX)
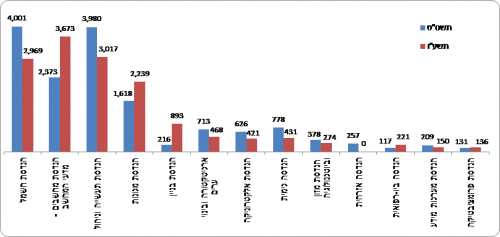
The most common subjects in the field of engineering in academic colleges and universities were: electrical engineering, industrial engineering and management, mechanical engineering and computer engineering - computer science. About two-thirds of all students in the field studied in these subjects. The number of students in the mechanical engineering profession increased from 3,445 in 4,812 to 40 in 3,262, an increase of 4,922% in seven years. In the computer engineering profession, the number of students increased from 50 in 2,373 to 3,673 in 64 (an increase of 10%). Most of the growth in this profession took place in the academic colleges, where most of the computer engineering students study. In the academic colleges, the number of students increased from 1 in XNUMX to XNUMX in XNUMX (an increase of XNUMX%). In these years there was also an increase in the professions of building engineering and civil engineering. On the other hand, in the subject of industrial engineering and management there was a significant decrease in the number of students (XNUMX%) and in the subject of electrical engineering there was a slight decrease (XNUMX%).
Chart 5 - Bachelor's degree students in engineering by profession, 2008/09 and 2015/16
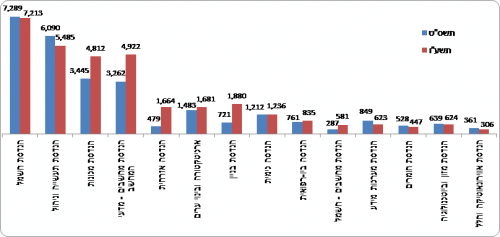
Chart 6 - Bachelor's degree students in engineering at universities by profession, 2008/09 and 2015/16
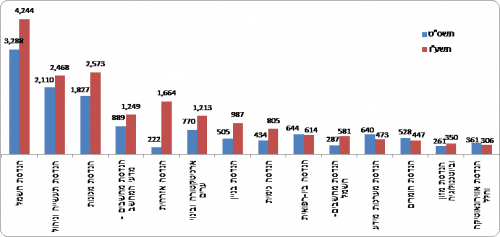
Chart 7 - Bachelor's degree students in engineering at the academic colleges by profession, 2008/09 and 2015/16
Recipients of a bachelor's degree in engineering
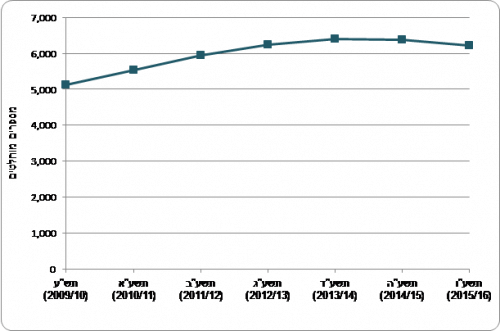
The number of bachelor's degree recipients in engineering increased from 5,118 in 2009/10 to 6,411 in 2013/14 (an average increase of 5.8% per year; see Chart 8). In the years 2014/15 and 2015/16, their number decreased and reached 6,218. The percentage of bachelor's degree recipients in engineering among all bachelor's degree recipients did not increase significantly in these years and it stood at 12%-11% (Chart 8). According to the social survey,[6] In 2015, percentage of engineering graduates among degree holders in the general population was higher and stood at 13.6%. The reason for the gap stems from the fact that the social survey data also includes recipients of degrees abroad (many immigrants arrived in Israel with a degree in engineering, especially in the great wave of immigration that began in the 90s). In recent years, the majority of engineers come from higher education institutions in Israel, so the percentage of engineers among all academics is expected to decrease over time.
Chart 8 - Recipients of a bachelor's degree in engineering, in the years 2015-16 (2009/10-XNUMX/XNUMX)
Engineering studies in Israel and the countries ofOECD
In 2015, the percentage of engineering graduates among bachelor's degree graduates in Israel was slightly lower than the OECD average (12.4% versus 13.4%, respectively). The percentage of engineering graduates among master's degree graduates in Israel was very lower than the average in the OECD countries (4.7% versus 12.5%, respectively). The percentage of engineering graduates among PhD graduates in Israel was also very lower than the average in the OECD countries (9.0% versus 16.7%, respectively).
Chart 9 - Percentage of bachelor's degree recipients in engineering From among bachelor's degree graduates in Israel and the countries ofOECD,[7] 2015
Advanced degrees in engineering
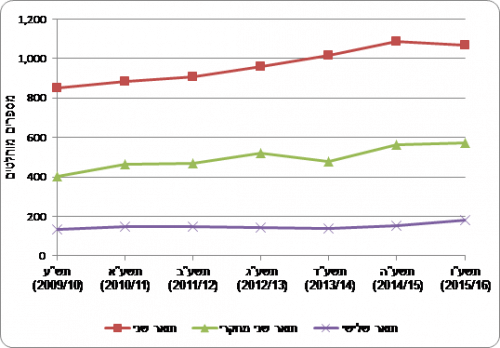
The number of recipients of a master's degree in engineering increased from 849 in 2009/10 to 1,087 in 2014/15 (an increase of 5.1% per year). In the year 2015/16 (1,070/XNUMX), the number of recipients of a master's degree in engineering decreased slightly and stood at XNUMX. Also a number of recipients of a master's degree in engineering in the research track[8] It went up - from 401 in 575 to 53.7 in XNUMX, which is XNUMX% of the recipients of a master's degree in engineering in XNUMX.
Chart 10 - Recipients of advanced degrees in engineering in the years 2015-16 (2009/10-XNUMX/XNUMX)
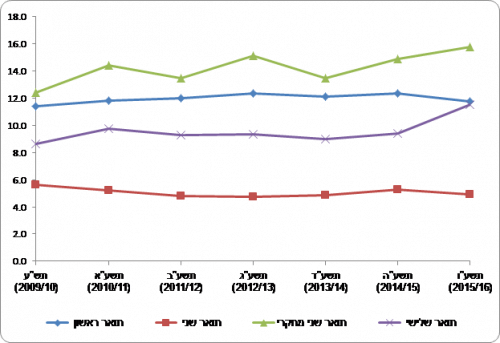
The percentage of master's degree recipients in the field of engineering is about 5% of all master's degree recipients. However, over the years in the field of engineering, the percentage of master's degree recipients in the research track was even higher than the percentage among bachelor's degree recipients. The percentage of those graduating from the research track in engineering among all those graduating from the research track is on the rise, from 12.4% in 15.7 to 149% in 181. In the years 11.5 to XNUMX, XNUMX graduates received doctorate degrees in engineering on average each year. In XNUMX there was a record of XNUMX recipients of doctorate degrees in engineering. The percentage of engineering degree recipients out of all doctoral degree recipients was XNUMX% in XNUMX.
Chart 11 - Percentage of recipients of degrees in engineering in the years 2015-16-2009
Intergenerational mobility of education
Compared to all degree recipients, engineering graduates come from educated families. 44% of those receiving a bachelor's degree in engineering in XNUMX had at least one parent with an academic degree,[9] Compared to 34.4% among all bachelor's degree recipients. Also, the percentage of university graduates coming from educated families is higher compared to college graduates. for half (49.3%) of those receiving a bachelor's degree in engineering From universities There was at least one parent with an academic degree, compared to 35.1% among graduates of academic colleges.
Of the four main engineering subjects, computer and electrical engineering graduates come from more educated families than mechanical and building engineering. 64% of those receiving a bachelor's degree in computer engineering from universities had at least one academic parent, compared to 48.4% of bachelor's degree graduates in civil engineering who studied at universities.
Chart 12 - Parents' education of engineering students (in the main subjects), by type of institution (XNUMX)
Definitions and explanations
The data presented in the current announcement are based on administrative files received from the higher education institutions. These include personal data of students and degree recipients as well as data on professions and degrees. These files go through a process of data processing, unification and refinement at the Bureau of Statistics. Data on the participation of high school graduates and those who excelled in psychometrics were obtained by linking student files and psychometric examinees to a student file. Data on parents' education was obtained by linking the file of degree recipients of XNUMX with the files of degree recipients of previous years and with degree weighing files.
The field of engineering includes the following professions: civil engineering, transportation and traffic engineering, water resources engineering and management, hydrotechnics, mechanics, building engineering, environmental engineering, geodetic engineering, mechanical engineering, electrical engineering, computer-electrical engineering, computer engineering - computer science (software ), electronic engineering, electro-optics engineering, communication systems engineering, aeronautics and space engineering, chemical engineering, biochemical engineering, food and biotechnology engineering, biotechnological engineering, pharmaceutical engineering - drugs, biomedical engineering, industrial and management engineering, information systems engineering , materials engineering, plastics engineering, quality engineering, agricultural engineering, architecture and urban planning, landscape architecture and engineering sciences, nuclear engineering, energy engineering, industrial design, content and production engineering, management and safety engineering, systems engineering, robotics engineering, mechatronics, geotechnology.
The psychometric score ranges between 200 and 800 and consists of three areas - verbal thinking, quantitative thinking and English. The average score is based on the highest score of the examinee in all his attempts. The data is based on the files of the psychometric exam examinees which are received from the National Center for Examinations and Evaluation. The grading scale for the quantitative part of the psychometric exam is 150-50.
Socio-economic cluster of a residential settlement Based on the publication of the socio-economic index for 2008. The local authorities were classified into 10 homogeneous clusters that are not equal in size according to their socio-economic index value. Cluster 1 indicates the lowest level, and cluster 10 - the highest level.
Graduates of the state-Hebrew education: a student who studied in the education system, under the supervision of the state-Hebrew (non-religious).
Graduates of state-religious education: Those who studied in their last year in the religious state-supervised education system.
Arab education graduates: Those who studied in their last year in the Arab state-supervised education system.
Educational institutions (2015/16)
Universities where engineering studies are taught: Hebrew University of Jerusalem; The Technion - Israeli Institute of Technoogy; Tel Aviv University; Bar-Ilan University; Ben Gurion University in the Negev; Ariel University in Samaria; Weizmann Institute.
The academic colleges where engineering studies are taught:
Ruppin Academic Center; Shankar - Higher School of Engineering and Design; Bezalel - Academy of Art and Design, Jerusalem; Lev Academic Center; Holon Institute of Technology; Ort Brauda Academic College of Engineering; Sapir Academic College; Afka - the Academic College of Engineering in Tel Aviv; Sami Shimon Academic College of Engineering; Azrieli-Jerusalem Academic College of Engineering; Kinneret Academic College in the Jordan Valley.
including a bachelor's degree such as: B.Tech., B.Sc., BA
including a master's degree such as M.sc., M.Tech., MA:
Including third degree: P.hd.
Comments
[1] They appeared in the XNUMXth grade student file in XNUMX
[2] Within 9 years of graduating from high school.
[3] The test takers of the psychometric exam in 2009 who began their studies in higher education institutions until 2015/16.
[4] The test takers of the psychometric exam in 2009 who began their studies in higher education institutions until 2015/16.
[5] 1-4 low socioeconomic cluster, 5-7 medium and 8-10 high.
[6] The data of the social survey, from which the data about the holders of the degrees in the general population were obtained, were limited to the age range 20-64, while the data of the recipients of the degrees are without age limit.
[7] According to OECD data, see the website: http://stats.oecd.org/#. as well as in advertising Education at Glance.
[8] The students in the research track are obliged to submit a final work (thesis).
[9] A degree received at a higher education institution in Israel or received abroad and submitted to the Ministry of Education and recognized as an academic degree.

2 תגובות
In my opinion, there is no need to force women into male professions, this is not what interests women and that is not what equality is about. If a woman wants to earn more, she should enter fields that do not interest her because that is what is considered more in society and that is where the pay is found. Women are more attracted to fields such as medicine, therapy , nutrition and nursing and these are professions that are no less important and are considered. The throat to educate the children of those engineers? So yes, if women want to enter the field of engineering or mechanical engineering, for example, they can, of course, but there is a feeling of pulling by force instead of encouraging women in fields that are considered more feminine, and that is where most women are. Why are fields that are considered more feminine automatically paid less ?
Due to the entry of academic colleges into the higher education market, the main victim is Ben Gurion University, which was left without sufficient demand for quality students.
The universities in Jerusalem, Tel Aviv and the Technion, including the universities in the center have always been and will be at least 20 degrees above Ben Gurion.
And when the academic colleges in the center and north entered the market in a big way, they actually eliminated Ben-Gurion.
By the way, when the downward trend in enrollment at Ben Gurion began, there was an embarrassing and humiliating trip by Ben Gurion University President Rivka Karmi and its CEO to China in an attempt to import students from China in place of the Israelis who do not enroll in Ben Gurion.
The nutritional experiment failed, the Chinese have their own universities, and those of them who come to Israel will surely prefer the universities in the center.
They did not come from China to get to a university in the southern periphery where a significant number of students issue a certificate of suffering from learning difficulties in order to receive academic concessions.