The CBS has published the statistics of applicants for bachelor's degree studies for universities[1] and the academic colleges[2] In the academic year 2015/16. The statistics Allows to assess the demand for higher education.
The data summary
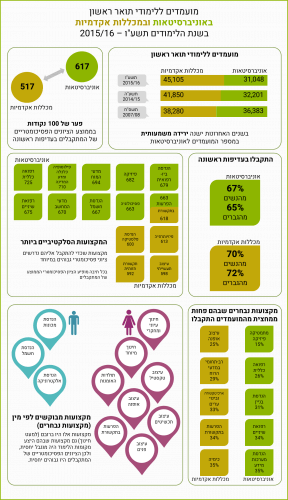
In recent years there has been A significant decrease in the number of applicants to universities (31.0 thousand applicants in 2015/16), compared to an increase in the number of applicants to academic colleges (45.1 thousand applicants this year).
Between the years 2014/15 and XNUMX there was an increase in the proportion of rejected candidates in universities (from 22.3% to 25.0%, respectively) and a decrease in academic colleges (from 20.8% to 15.1%, respectively).
The offer of professions which can be studied in universities twice as much as in colleges, but The offer of the number of places for students in law studies, as well as in business and management sciences higher in academic colleges.
The subjects of study in which the supply in the universities was much lower than the demand (of the candidates) were: emergency medicine, general medicine and dentistry. in colleges the academies The subjects of study where the supply was much lower than the demand were: fashion design, occupational therapy and communication disorders. In both universities and academic colleges, the supply was lower than the demand in architecture and urban planning as well as in building engineering.
There was a significant gap between the universities and the academic colleges in the averages of the psychometric scores of those admitted with first priority (617 versus 517 points, respectively - a difference of 100 points on average), especially in biology (a difference of 157 points on average).
The selective subjects the most (subjects in which particularly high psychometric scores are required to be admitted in first priority) in universities were: general medicine (725), the combined program of philosophy, economics and political science (710), neuroscience (694), physics (682), biomedical engineering (679), dentistry (675), computer science (670) , electrical engineering (667), psychology (663), communication disorders (663), computer engineering - computer science (662), law (660), medical science (656), food engineering and biotechnology (653) and materials engineering (649). in the academic colleges The most selective subjects were: communication disorders (618), physical therapy (613), plastic engineering (600), industrial design (598) and visual communication (592).
54.7% of university applicants were women. Their rate among the candidates of the academic colleges was 57.6%.
The following professions were almost exclusively sought after by me women: theoretical and research education, special education, art history, fashion design, textile design, jewelry design, interior design, communication disorders, occupational therapy and pharmaceutical engineering. On the other hand, the professions in which there was a demand mainly by Men There were: mechanical engineering, electrical engineering and electronics engineering.
There is a very significant increase in the rate The Arab candidates in the academic colleges (from 15.3% in 19.9 to 19.4% in 19.8) and a slight increase in the proportion of Arab candidates in universities from XNUMX% to XNUMX%. But the acceptance rates in first priority of the Arabs are lower compared to the Jews and the others both in universities (49.4% compared to 70.3%, respectively) and in academic colleges (64.5% compared to 72.6, respectively).
Professions that are relatively more in demand among theArabs (more than half of the candidates) are: Hebrew language, Hebrew literature, Arabic language and literature, English language and literature, theoretical and research education, culture and art as well as laboratory medical sciences.

Candidates by type of institution
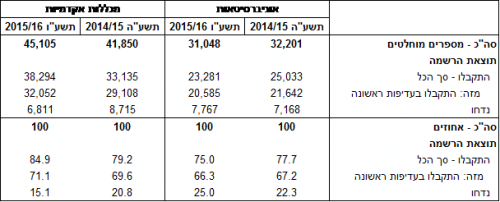
In 2015/16 (31.0/40.8), 45.1 thousand candidates submitted 50.0 thousand registration forms for bachelor's degree studies in universities, and 6.9 thousand candidates submitted 4.1 thousand registration forms for bachelor's degree studies in academic colleges. XNUMX thousand university applicants applied to two or more universities, and XNUMX thousand academic college applicants applied to two or more colleges.[3] In the universities, the average enrollment per candidate was 1.3, while in the academic colleges this average was 1.1. 67.2% of university applicants were accepted in first priority Compared to 69.6% of applicants to academic colleges.
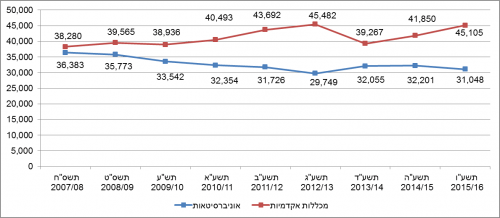
Despite the expansion of the higher education system, in recent years there has been a significant decrease in the number of applicants to universities. Thus, in the period between 2007/08 and 2015/16, the number of applicants to universities decreased by 5.3 thousand - a total decrease of 14.7%. This is despite the fact that in 1, the candidates of Ariel University were also added, which turned from an academic college into a university (see diagram XNUMX).
In XNUMX they were accepted in first priority 66.3% of university applicants compared to 71.1% of academic college applicants[5]. Between the years XNUMX and XNUMX, there was an increase in the proportion of rejected applicants (those who were not accepted - whether first priority or otherwise) in universities and a decrease in academic colleges.
Between XNUMX and XNUMX the number of candidates To universities decreased by 3.6% (from 32.2 thousand compared to 31.0 thousand, respectively), the rate of those admitted in first priority Decreased from 67.2% to 66.3% - a decrease of 0.9 percentage points. At the same time, the rate of rejections increased from 22.3% to 25.0%.
In these years, the number of candidates to the academic colleges increased from 41.9 thousand in 45.1 to 10.5 thousand in XNUMX, an increase of XNUMX%. Compared to universities, the rate of those admitted has increased in first priority in the academic colleges (from 69.6% to 71.1%, respectively), and the rejection rate decreased by more than 5 percentage points (from 20.8% to 15.1%, respectively; see Table A).
Candidates according to preferred fields of study and subjects
The classes of the accepted candidates in first priority Tested in subjects preferred by at least 50 university applicants or to the academic colleges.
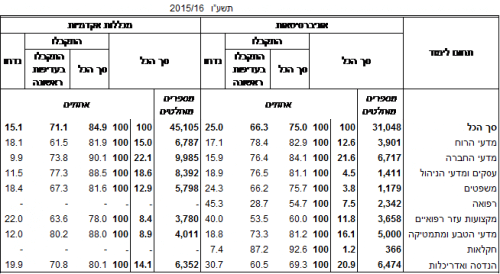
The differences in the supply between the universities and the academic colleges are reflected in the number of students studying in these institutions according to fields of study.[6] For data on candidates (cf Panel B). The supply of the number of places in law studies, as well as business and management sciences, was greater in academic colleges than in universities. On the other hand, the supply of the number of study places in the fields of natural sciences and mathematics was greater in universities than in academic colleges. It is important to note that there is complexity regarding the offer of the humanities. In the universities, the supply was greater for subjects related to the general humanities (such as philosophy and history) as well as for subjects related to languages, literatures and regional studies. In the academic colleges, on the other hand, there was a much greater supply for humanities subjects associated with art, fine arts and applied arts. It should be noted that in 2015/16, the fields of medicine and agriculture could only be studied at universities.
In universities, the highest first priority acceptance rates were among applicants who preferred to study in the field of agriculture (87.2%) and among applicants who preferred to study in the field of humanities (78.4%).[7] The lowest rates of those accepted were for studies in the field of medicine (28.7%), in the field of medical auxiliary professions (53.5%) and in the field of engineering and architecture (60.5%).
In the academic colleges, the highest rates of first priority admissions were among those who preferred to study in the field of natural sciences and mathematics (80.2%),[8] in the field of business and management sciences (77.3%) as well as in the field of social sciences (73.8%). The lowest acceptance rates were in the field of humanities (61.5%),[9] and in the field of auxiliary medical professions (63.6%). First priority acceptance rates for the fields of engineering and architecture in academic colleges were higher than in universities (70.8% vs. 60.5%, respectively), as were the natural sciences and mathematics fields (80.2% vs. 73.3%, respectively).
As mentioned, between 5.8 and 3.5, the percentage of applicants who were rejected at universities increased and decreased at academic colleges. Examining the trends according to preferred fields of study indicates that in the universities the most significant increases were among those who preferred to study medicine (an increase of 15.4 percentage points) as well as among those who preferred to study law (10.3%). In the academic colleges, their rate decreased especially among candidates who preferred to study auxiliary medical professions (6.1 percentage points), humanities (XNUMX) as well as business and management sciences (XNUMX percentage points).
To give an indication of ease/difficulty of acceptance in first priority For a particular profession we will use the demand/supply ratio (total bachelor's degree applicants, divided by total applicants who were accepted as first priority in academic colleges, according to first priority field of study).
In 80 in the universities, the subject of study in which there was the highest match between demand and supply (that is, more than XNUMX% of the applicants were accepted in first priority) was in linguistics (81.0%). In contrast, there were 16 subjects in which the supply was significantly lower than the demand (subjects in which less than half of the applicants were accepted): mathematics-physics (15.0%), general medicine (25.5%), construction engineering (30.9%), dentistry (33.6%) ), information systems engineering (34.8%), emergency medicine (36.0%), computer engineering-computer science (36.1%), multidisciplinary humanities (42.9%), Arabic language and literature (43.6%), nursing (44.5%) , laboratory medical sciences (46.3%), communication disorders (47.3%), English language and literature (47.7%), architecture and urban planning (48.6%), pharmacy (49.4%) and theoretical and research education (49.5%).
in the academic colleges, the highest match between demand and supply (ie, more than 80% of applicants were accepted in first priority) was in the following subjects: physiotherapy (89.6%), culture and art (87.8%), technology for learning systems (87.7%), mathematics (85.6%), food science (84%), management sciences-information systems (83.7%), systems Information (82.3%), health systems management (80.8%), logistics (80.2%). In contrast, there were 12 preferred subjects in which less than half of the applicants were accepted: fashion design (25.4%), multidisciplinary humanities (29.3%), architecture and urban planning (33.2%), communication disorders (33.9%), chemistry (35.1%) , occupational therapy (37.0%), theater history (37.7%), general manager and public administration (44.2%), building engineering (45.5%), visual communication (45.7%), industrial design (48.7%), interior design - structure and environment (49.3%).
The rate of test takers in the psychometric exam
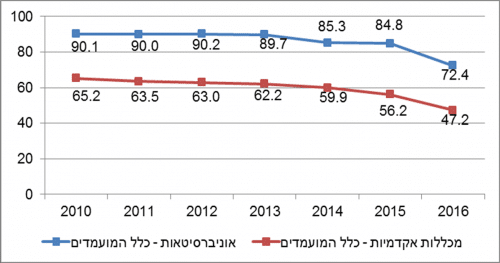
In the last year, there has been a large decrease in the percentage of examinees, both in academic colleges and universities. In universities, the percentage of those taking the psychometric exam is significantly higher than the percentage of those taking the academic colleges, but this percentage is decreasing. In 2010, 90% of university applicants were tested, but in 2016, only 72% were tested. In 2010, about two-thirds of the candidates for the academic colleges were tested, but in 2016, less than half were tested in the psychometric exam.
Similar percentages of distinctions were found between all the candidates and the candidates who were accepted with first priority.
Candidates according to psychometric score
You can also learn about the high demand for the various professions from the average psychometric score of those admitted to first priority. As a general rule, the more in demand the profession is, the higher the threshold for entering it, which is reflected in the psychometric test score of those admitted. There is a significant difference between the average psychometric score of the candidates admitted to the universities and that of the candidates admitted to the academic colleges[10] (617 versus 517 points, respectively - a difference of 100 points). This gap existed in all preferred fields of study. The most moderate differences were among those admitted in first priority for auxiliary medical professions and for business and management sciences (gaps of 53 and 77 points, respectively). The most significant gap was among those admitted to law (a gap of 135 points on average), followed by those admitted to social sciences (a gap of 108 points on average. See diagram 3).
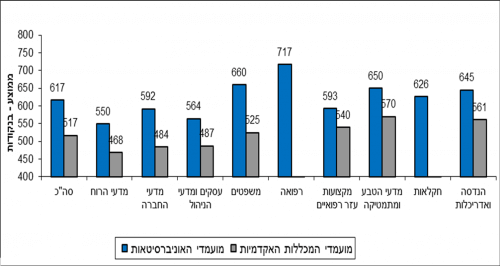
The subjects in which there was the highest difference in the average psychometric score between the universities and the academic colleges were: biology (an average of 629 points in the universities compared to 472 in the academic colleges) and sociology and anthropology (an average of 559 points in the universities compared to 414 in the academic colleges).
The subjects in which there was the lowest difference in the average psychometric score between the universities and the academic colleges were: East Asian studies (average of 568 points in the universities compared to 543 in the academic colleges) and management sciences-information systems (averages of 565 and 548 points, respectively)
From the aspect of the achievements in the psychometric exam, the 15 most selective subjects in universities There were: general medicine (average psychometric score of those accepted in first priority 725), the combined program of philosophy, economics and political science (710), neuroscience (694), physics (682), biomedical engineering (679), dentistry (675), computer science (670), electrical engineering (667) ), psychology (663), communication disorders (663), computer engineering - computer science (662), law (660), medical science (656), food engineering and biotechnology (653) and materials engineering (649). in the academic colleges, the 5 selective subjects were: communication disorders (618), physical therapy (613), plastic engineering (600), industrial design (598) and visual communication (592).
women and men
54.7% of university applicants were women. Their rate among the candidates of the academic colleges was 57.6%. 67.2% of the women who applied to universities were accepted in first priority, compared to 65.3% among the male candidates. 70.4% of the women who applied to the academic colleges were accepted in first priority, compared to 71.9% among the male candidates.
there are Study subjects for which the demand is gender specific.
Professions[11] In which there was a demand mainly by women (between 90% and 99%) were: theoretical and research education, special education, art history, fashion design, textile design, jewelry design, interior design, communication disorders, occupational therapy, pharmaceutical engineering, drugs . In contrast, there were professions in which there was a demand mainly by men (over 85%) - mechanical engineering, electrical engineering and electronic engineering. These professions (demanded mainly by women or mainly by men) were mostly (with the exception of education) also professions in which the supply of study places was relatively limited, and therefore the psychometric scores of those accepted were relatively high.
Arabs
There is a very significant increase in the proportion of Arab candidates in academic colleges from 15.3% in 19.9 to 19.4% in 19.8 and in universities from XNUMX% in XNUMX to XNUMX% in XNUMX. In the universities there were significant gaps between the acceptance rates in first priority of the Jews and the others and the Kabbalah classes in first priority of the Arabs (70.3% versus 49.4%, respectively) and the same in the academic colleges (72.6% versus 64.5%, respectively).
Subjects of study[12] in which more than a third of those who preferred were Arabs: Arabic language and literature (73.4%), culture and art (72.2%), English language and literature (71.0%), laboratory medical sciences (63.8%), Hebrew literature (61.5%), Hebrew language (56.8%), theoretical and research education ( 52.7%), nursing (49.1%), teacher training (48.8), pharmacy (48.1%), health systems manager (47.8%), management information systems (46.7%), art history (45.1%), musicology (45.0%) , education (40.8%), multidisciplinary social sciences (40.7%), food engineering and biotechnology (39.7%), optometry (39.2%), mathematics-physics (37.5%), medical sciences (36.7%), dentistry (33.1 %).
Definitions and explanations
The population of the announcement includes candidates for undergraduate studies at universities[13] and in the academic colleges[14] for the year 2015/16.
A candidate is a person who has submitted an application for admission to first-year studies for a bachelor's degree at a university, at a recognized academic college (one or more) or at a branch of a university. Any such request is a registration.
For both universities and academic colleges, applicants were counted once (head count) according to the registration form in which the applicant received the best result, in the following order: accepted and studying, accepted and not studying, rejected.
A first priority study subject is a subject marked as first priority on the registration form.
A preferred field of study is the field to which the subject of study is associated with first priority (in the file).
The study subjects were grouped according to the scientific field to which they belong. The scientific fields were presented in the tables at several levels of detail, as follows:
| 7 areas | 9 areas | 15 areas |
| Humanities | Humanities | General humanities |
| Languages, literatures and regional studies | ||
| Education and training for teaching | ||
| Arts, crafts and applied arts | ||
| Special and different study programs | ||
| Social Sciences | Social Sciences | Social Sciences |
| Business and Management Sciences | Business and Management Sciences | |
| laws | laws | laws |
| Medicine and auxiliary medical professions | medicine | medicine |
| Auxiliary medical professions | Auxiliary medical professions | |
| Natural Sciences and Mathematics | Natural Sciences and Mathematics | Mathematics, statistics and computer science |
| physical sciences | ||
| biological sciences | ||
| agriculture | agriculture | agriculture |
| engineering and architecture | engineering and architecture | engineering and architecture |
First priority admission - candidates who were admitted to the subject they marked as their most preferred - whether they decided to study it or not.
The psychometric score ranges between 200 and 800 and consists of three areas - verbal thinking, quantitative thinking and English. The average score is based on the highest score of the examinee in all his attempts. The data is based on the files of the psychometric exam examinees which are received from the National Center for Examinations and Evaluation.
Selective profession - a profession that requires a particularly high psychometric score to be accepted.
Population and religion group - the "Jews and others" population includes: Jews, non-Arab Christians and people without a religious classification in the population registry; And the Arab population includes: Muslims, Christian-Arabs and Druze.
- [1] Does not include the Open University where all candidates for undergraduate studies are accepted.
- [2] Not including academic colleges of education where the studies are mainly for teaching training (about 98% of the students).
- [3] In addition, 4.0 thousand candidates applied to both universities and academic colleges.
- [4] Ariel University in Samaria (formerly: "Ariel University Center in Samaria") - up to XNUMX (including this year) the institution's data are included in the data of the academic colleges. Starting from XNUMX, the institution's data are included in the universities' data.
- [5] There are several ways in which the acceptance rates of applicants can be measured. In this announcement, all references to the admission of candidates refer to the admission to the most preferred profession (first priority) that the candidate indicated on the registration form.
- [6] For data from the year 14, see the press release published on October 2015, 6 (Higher education in Israel - selected data for the opening of the academic year 2016). For data from the year 2015, see the press release published on November 16, XNUMX (Higher education in Israel - selected data for the year XNUMX (XNUMX/XNUMX) on the occasion of the opening of the academic year).
- [7] Expanding to the level of 15 fields (see the definitions chapter), it seems that in the field of "special and different curricula in the humanities" the acceptance rates are 92.9%.
- [8] Expanding to the level of 15 fields (see the definitions chapter), it seems that in the field of "languages, literatures and regional studies" in the humanities the acceptance rates are 36.4%.
- [9] Expanding to the level of 15 fields (see the definitions chapter), it seems that in the field of "mathematics, statistics and computer science" the acceptance rates are 82.5%.
- [10] The percentage of those taking the psychometric test was higher among the university candidates than among the academic college candidates (72.4% versus 47.2% and in the previous year: 84.8% versus 56.2%, respectively).
- [11] The rates of the men and women were tested in subjects that were the first priority among at least 50 candidates of both sexes and from each type of institution.
- [12] The classes of the Arabs were tested in subjects that were the first priority among at least 50 candidates from each population group and each type of institution.
- [13] Does not include repeat registrants. In addition, it does not include the Weizmann Institute of Science where there are no studies for a bachelor's degree, but for advanced degrees (second and third) only. In addition, it does not include the Open University where all candidates for undergraduate studies are accepted.
- [14] Does not include the Schechter Institute for Jewish Studies where studies are not held for a bachelor's degree, but only for a master's degree. In addition, does not include academic colleges of education.
